
Axisbank yesterday has traded around its highest level and was able to close comfortably there. But an all-time high is still 1% away, so what should be our approach? Shall we buy or sell this stock? Axis bank analysis will clear this all. Let us find the answer with technical analysis and by watching derivatives data. Technical analysis on Axisbank: Axis bank has tested its previous high ... [Continue Reading]
20 Must Read books on trading by legendary traders

Trading is all about learning and then experimenting with it. Either you learn from your own bad experience or you learn from those who already have made a lot of money from trading. Here are few must-read books on trading if you want to learn to trade. We all are in the learning stage, if you want to be successful at trading then you will need to continuously learn. You need to create a model ... [Continue Reading]
Can we expect Nifty at 15000 in 2 years?
Nifty and Sensex has outperformed all the global markets. India has been the fastest growing economies amongst large economies. Thanks to the strong government led our PM, Narendra Modi. Strong decisions taken by the central government has shifted the economy to the next gear. Files are getting cleared in no time, environmental clearances take 15 days or so. This has help economy come on the ... [Continue Reading]
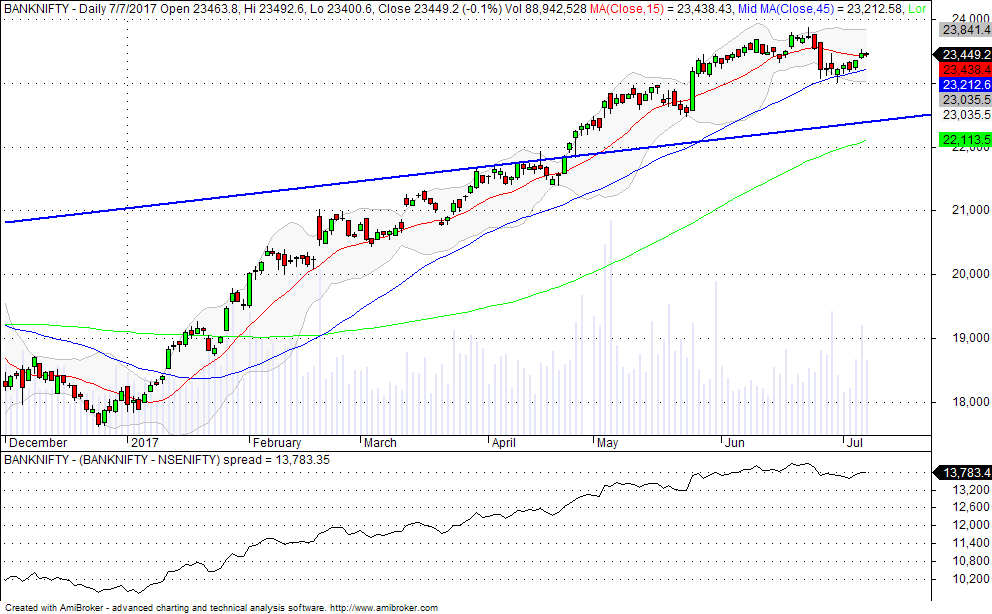
Bank Nifty and Banking sector outlook for short term
Bank nifty and Nifty futures has been trading higher for almost 1.5 years. This all started back in the month of September 2013 when Shri Narendra Modi was declared as PM candidate of BJP. After registering a massive win by BJP in general election we saw lots of bulls joining the stocks and moving it northward. We are expecting this uptrend to continue until the government is pushing in the ... [Continue Reading]
How is transaction cost important in trading and how to reduce it?
Trading as a career opportunity is thought of many people nowadays especially youths. But before considering trading as a career opportunity many things need to be taken care of. While trading is different from investing, people who want to become professional traders should follow several things. These could be like: strict discipline, trend, risk management, technical analysis, sources of news, ... [Continue Reading]
- 1
- 2
- 3
- …
- 8
- Next Page »