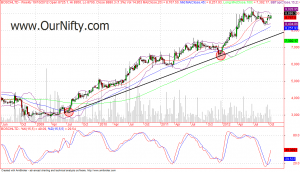
Trend lines are most frequently used tool in technical analysis, they can be used to get entry at the bottom/top of pullback. Its great to observe how price action finds support at the testing of trend line. For drawing a trend line you will just need two points, either two major tops or major bottoms. Just as shown in below chart:
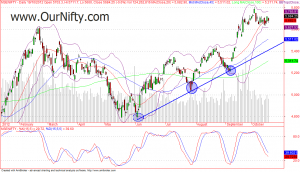
Now we will just wait for price to come towards trend line and then we will be taking positions on the testing of that trend line, see the chart below, its of nifty spot. Just see how the price has bounced on touching the trend line third time.
Drawing trend line is that simple and can be used in any time frame chart, can be daily chart, weekly chart or any intraday time frame chart. Doing this type of analysis is very simple and easy to learn with technical analysis course.


Leave a Reply