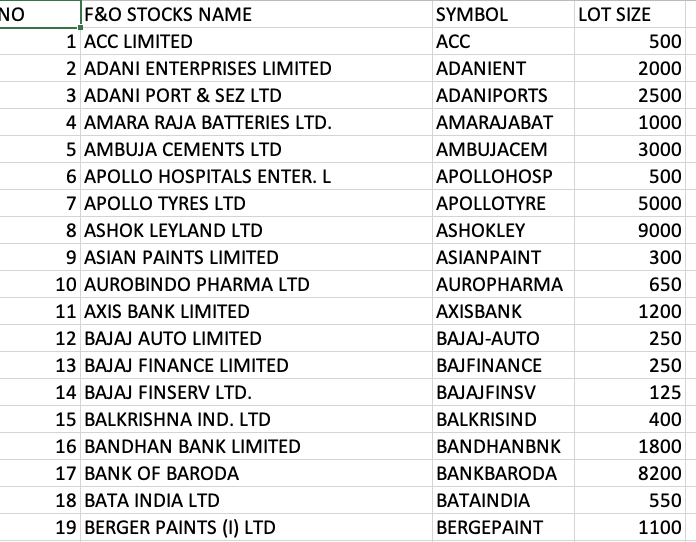
There has been a lot of changes in the nse Futures and options segment. What I have observed is this time many stocks were included and few excluded. I think it is necessary to update traders with the current nse f&o stock list of stocks that are available for trading under F&O. NSE's F&O segment is very active and liquid. It is one of the largest derivatives exchanges in the ... [Continue Reading]
Nifty future range trading strategy: Trade Support and resistance
Here is short term range trading strategy for nifty future, hourly chart suggest levels of support resistance for short term: Strong support can be found at 5640 level, where as strong resistance 5720 level for nifty spot. So, one can buy nifty around 5640 level for target of 5700 and one can short nifty at 5720 for target as 5670 level. Stop loss will be, exit when nifty breaks out of this ... [Continue Reading]
Nifty options open interest sheet for November expiry series
Here is the link to download excel sheet to keep a track on the nifty options open interest and do analysis on it. This is how you can do the analysis using open interest data of nifty options. Download from here. Sheet will auto refresh itself every 5 minutes. You will have to disable security warning, else it will not refresh the data. Next week's analysis: I am seeing some correction ... [Continue Reading]
Nifty Next week: Some thing is unusual, Nifty options open interest
About 11 million (1.10 crore) shares were seen in total open interest of nifty 5800 call option. Having such a high open interest is unusual thing and has many surprises in it. What I feel is market might have created a intermediate top for short to medium term. Suggests some selling is on the way for markets, VIX is also around 52 week low. Suggest me that nifty is going to see major selling in ... [Continue Reading]
Trend line A perfect analysis tool: Drawing Trendline Correctly
Trend lines are most frequently used tool in technical analysis, they can be used to get entry at the bottom/top of pullback. Its great to observe how price action finds support at the testing of trend line. For drawing a trend line you will just need two points, either two major tops or major bottoms. Just as shown in below chart: Now we will just wait for price to come towards trend line and ... [Continue Reading]
- « Previous Page
- 1
- …
- 13
- 14
- 15
- 16
- 17
- …
- 167
- Next Page »
