• Trading Account
  • Downloads
  • Nifty Options OI
    • Nifty Max Pain Chart
    • Nifty Option Change in OI Chart
    • Nifty Put Call Ratio
    • Nifty Option Total Change in OI
    • Nifty Trend Finder
  • BankNifty Option OI
  • About Us
  • Learn Technical Analysis
    • Advance Option Trading Course

OurNifty.com

A Indian Stock Market Blog

  • Forex
  • Gold
  • Intraday Stocks
  • Midcap Stocks
  • Multibagger
  • Nifty
  • Nifty Option
  • NSE
  • Amibroker

Stochastic Gave Buy Crossover in ACC weekly chart, Buy ACC

By Bhaveek Patel 2 Comments

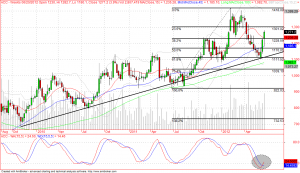
ACC is one of those cement stocks, which are in a strong uptrend since 2009. So taking trade in the direction of this up trend, I look for buying this stock on every dips. You will see stock is taking support at trend line and bounces from there, trend line is excellent support in this case. Here to get the buy entry I use slow stochastic indicator, on the weekly chart of ACC below slow stochastic has given crossover below 20 level. When such crossover happens in the direction of trend, it gives strong buy signal, in this case it is ACC on weekly chart. Refer below chart of ACC on weekly time frame:

ACC weekl chart analysis, stochastic gave buy cross over

Trading call on ACC: I would be initiate long positions after the CCI report which is expected to come out tomorrow, report will reveal that if there is any penalty on cement companies. However my long positions in ACC future would be around 1240 – 1250 for positional target of 1300 and placing stop loss just below 1228 on closing basis. This article was published on date time: 20/06/2012, 23:08 PM.

This technical analysis was shared to me by Anu Kumar Anupam, my student who completed technical analysis course sometime ago. After completing this course you will be able to perform such analysis, for more details on course call me on +91-9970777789.
Share3
Tweet
Pin
3 Shares

You Should Read This:

  1. Trading Nifty Future Using Slow Stochastic Indicator for Intraday and Positional Trading Market environments are always classified into 2 different types, 1. Trending Market 2. Ranging Market First we will see how to trade trending markets using slow stochastic indicator, let me show you this step by...
  2. Buy Nifty future, Slow Stochastic gave Crossover on Daily chart Nifty future has opened with gap on Friday’s trading session, I have been bullish on Nifty and bank nifty from last 2 – 3 months, yet this is another confirmation for us to be on...
  3. Medium term Investment Stock: Buy Ajanta Pharma for target 486 Ajanta pharma (NSE code: AJANTPHARM), is one of the most outperforming stocks in the pharmaceutical sector. On weekly chart we have seen an excellent trading pattern, we see stock has been in uptrend and this...
  4. Technical Analysis: JP Associates tests trend line support JP Associates on the daily chart is on the perfect uptrend and as the trend is up we only focus on buying it on every declines. Last 2 trading session has been interesting for the...
  5. Find Nifty Futures Targets with ATR Indicator on Weekly Chart ATR stands for Average True Range, ATR indicator is used to find the average (absolute) range for a specified period of time. So the value seen on this indicator is just the average range which...

Category: Technical Analysis Tags: Buy ACC Future/ Slow Stochastic/ Weekly Charts

About Bhaveek Patel

Bhaveek Patel is one of the most successful traders, technical analyst, and investor, his areas of interest include stock market, forex, and gold trading. Apart from this, he is often seen in the golf course. He is having more than 10 years of experience in trading, had placed his first order on 19 June 2006 with IndiaInfoline.

Leave a Reply Cancel reply

Your email address will not be published. Required fields are marked *

Previous Post: How NEWS can impact near term nifty future price action
Next Post: Nifty Options Low risk trade, Buy Nifty 5200 Put Option

Advance Options Trading Course

options trading course

Lowest Brokerage Trading A/c

Lowest brokerage trading account opening in India

Learn Technical Analysis

technical analysis course

Recent Articles

  • ASX Penny Stocks List for 2023
  • 7 Ways to Boost Your Revenue
  • NYSE Penny Stocks List for 2023
  • Short On Cash? Here’s How You Can Manage Your Priority Spends
  • FREE Webinar on Option Chain Analysis
  • LSE Penny stocks list for trading in 2023 Should you buy?
  • BSE Penny Stocks List 2023

Popular Categories

Amibroker Finance Forex Gold Intraday Stocks IPO Midcap Stocks Multibagger NEWS Nifty Nifty Option NSE Short Term Stocks Technical Analysis

About Us | Contact Us | Privacy Policy | Disclaimer


Copyright © 2009 - 2023 OurNifty.com Trading ideas published here cannot be reproduced without permission from the author.
OurNifty is Powered by Wordpress and hosted on Digital Ocean