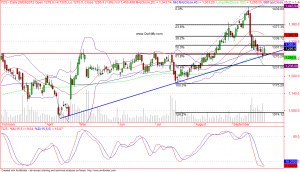
Yesterday while I was resolving a query for one of my client I have landed into the TCS chart; I found that stock is ready for its next up move. So taking the positions in the direction of the trend I will be looking for buying opportunities, as long as the trend remains up. Moreover stock is trading at 100 EMA and trend line is support here, also Fibonacci retracement level 61.8% level is coinciding at the same place. A crossover on slow stochastic indicator is best confirmation to be on long side. Previously the 1280 level was strong resistance and it was very difficult for bulls to break that barrier, but as the price action is above this level so its now a support. Hence this setup is a “Million dollar” or “Once in a month” like trading opportunity. Being a high probability trade setup one can risk as much as 6 to 9% of his trading capital, but not more than that. Look at the TCS daily chart for clear info what we have done:
Trade setup: Buy TCS at 1295 for a positional target as 1375 and then 1440. Stop loss for this trade must be below 1260. Risk reward ratio is 1:2 hence worth taking risk. Trading idea published on 1 October 2012.
You can invite us at your place for Large / small seminars on Technical Analysis, call us on +91-9970777789 for complete information.

i m interested in technical analysis course.please provide me details