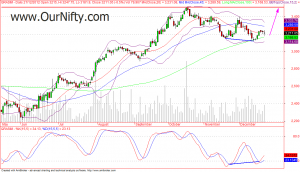
Grasim’s daily chart shows the trend in stock is up, hence trading in the direction of the trend we will be looking for buying opportunity in this stock. As we give closer look to the daily chart we see a bullish divergence forming on slow stochastic indicator.
Daily chart of GRASIM:

Traders can take long position on Grasim in range of 3170 – 3230 for target of 3500 in short term. While placing stop loss just below the low which stock has made recently, so stop loss must be below 3120 level. We have also noticed stock is consolidating around 100 EMA, which is considered as a support on daily chart. These are all the signs that the stock is going to bounce and resume its uptrend. Article written on 21 December 12.
Leave a Reply