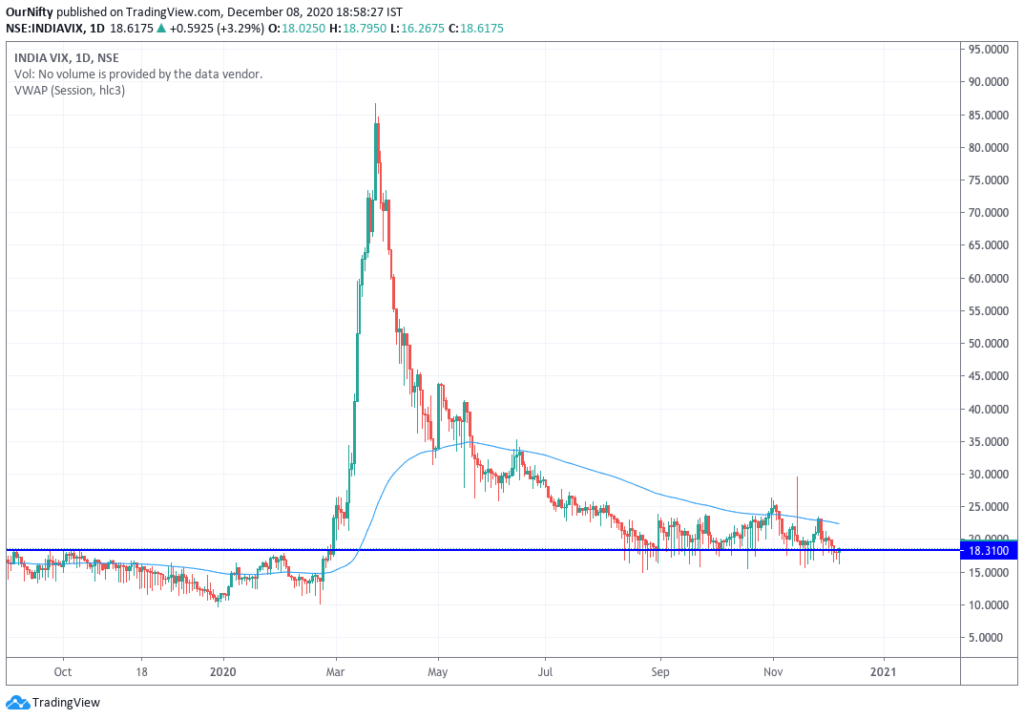
In India, markets have seen a significant increase in the volatility index. We have VIX in NSE, which has recently been inching towards 20. Let us see in detail how to read India VIX and use it in trading nifty future.
Few traders are using VIX to see the correct direction of Nifty future and also find the correct and most probable reversal point.
VIX also tells us about the high risk or low risk for the nifty positional traders and also option writers.
What is volatility index India VIX?
Before learning the volatility index let’s understand what is volatility. So volatility is the amount by which the price fluctuates in a period of time.
It is measured by some mathematical calculations… I am sure you don’t want to go into that detail. The volatility index shows this fluctuation of prices over a given period.
How is volatility measured?
In NSE, there is a special index for measuring the volatility, it is India VIX. One can even see the charts of VIX on a real-time basis.
However there are technical indicators, that can be used to measure volatility in the market. Bollinger bands and Average True Range (ATR) are most commonly used to keep track of price fluctuations and volatility.
The India VIX uses the implied volatility of NSE NIFTY options and is helpful in predicting overall market volatility for the next 30 days.

A falling VIX means that there is lower uncertainty and market confidence is high. Low India Vix means most of the time direction of the trend is clear.
A rising India VIX shows there is a lot of uncertainty/fear in the markets. Price action can be very volatile in the coming few days, so be extra careful.
How to do trading using India VIX?
We know high volatility makes the markets choppy/ range-bound or volatile. So while looking to trade nifty future or option selling one should check India Vix.
In low volatility, trend traders can keep holding on to their positions with a stop loss. Trends are much easy to capture in low vix markets.
Nifty option seller should keep watch on volatility before taking the trade. High volatility will make the price fluctuate and may see whip-saw moves. Therefore the trading risk during high vix will also be higher.
On the other side if you are a trend following trader. To confirm if the current trend will continue or not then, you should check the low volatility in the India VIX chart.
If nifty is trending with low volatility then it is most likely to continue moving in the same direction.
I will recommend trading only when the VIX is moving lower and a level below 20 is ok for trading. With VIX above 40, the chances of a reversal in the short-term trend are also high. Large and sudden moves could be expected in the high Vix regime.
Trade nifty options with 3x intraday leverage with Upstox. Check Online Options Trading Course and also technical analysis course.
thnx sir
very helpful information
Hi,
Thanks sir for the information on the Volatility index calculation. I needed it for one of my assessments.
Thanks
Rajeev
Hi bhaveek, I have been following your blog for some time. I didn’t see any research from you, I was wondering if you can write some articles on nifty future.
VIX is confusing me a bit, could you please advice me some fool proof rules/strategy based on the Nifty VIX.
I am a nifty options trader, I want to know the current trend in nifty future and also your view where do you see nifty to expire in this series.
Quick reply appreciated. 🙂
Thanks
where can I find nifty vix charts with real time updation??? I want free charts only.
you r saying the range of VIX is 0-100. but in my Trading Work Station it’s present value is 1628.5. please explain the discrepancy….
in trading work station the reading or vix is 1628 means its acually 16.28. Dont be confused.
what is the difference between real time volatility and real time volatility? How to calculate real time volatility? any excel formula or link where it is available easily.
what is the difference between historic volatility and real time volatility? How to calculate real time volatility? any excel formula or link where it is available easily.
Those who trade in nifty call and put they should enter market when vix is below 15 and exit when above 20 for safe game by looking into other indicatior like Gann Hilo or RSI.
santosh you can directly take data from nseindia.com in your excel sheet.
under head data from external link
now play on vix column.
add new column if vix is below 15 you can buy and above 20 sell
where can I find nifty vix charts with real time updation??? I want free charts only.
hi , how do i download India vix data , i am not an investor rather beginner in the research on stock market
The India VIX calculation is based on the Black Scholes Model which is used to price options contracts. The Black Scholes model uses five key variables to arrive at the ‘fair price’ of an options contract: the strike price of the contract, the market price of the stock, the time to expiry, the risk-free rate, and volatility. The VIX arrives at the volatility expected by the traders in the market by back-working from buy-sell prices of Nifty options contracts.
Interesting article about trading. Nifty & volatility trading is essential for the traders to continue their business.