• Trading Account
  • Downloads
  • Nifty Options OI
    • Nifty Max Pain Chart
    • Nifty Option Change in OI Chart
    • Nifty Put Call Ratio
    • Nifty Option Total Change in OI
    • Nifty Trend Finder
  • BankNifty Option OI
  • About Us
  • Learn Technical Analysis
    • Advance Option Trading Course

OurNifty.com

A Indian Stock Market Blog

  • Forex
  • Gold
  • Intraday Stocks
  • Midcap Stocks
  • Multibagger
  • Nifty
  • Nifty Option
  • NSE
  • Amibroker

Trade using Gartley Pattern, Learn and trade patterns

By Bhaveek Patel 9 Comments

Another interesting tradable pattern is the Gartley Pattern. The Gartley pattern one of those most traded pattern, which takes advantage of higher risk reward ratio. This pattern shows major reversal points in market, also it works with slowing momentum if not reversal. So most of the time you will apply this pattern in medium term chart like weekly chart. Fibonacci retracements play important role in this pattern as reversal points are on retracement levels.

There are two types of Gartley pattern:

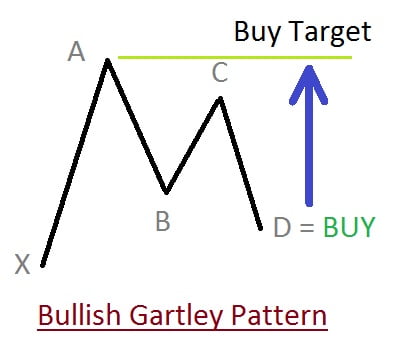
  1. Bullish Gartley Pattern.

  2. Bearish Gartley Pattern.

The bullish pattern is as seen below, its formation is quite similar to inverse head and shoulders pattern, but as you can see below point C is not on the same level as point A.

Formation and trading strategy of Bullish Gartley pattern:

  1. Point B must retrace 61.8% of AX movement.
  2. Point C must retrace anywhere from 38.2% to 88.6% of BA movement.
  3. Point D must be 138.2% or 161.8% extension of the BC movement.
  4. Point D must retrace 76.8% of AX movement. This is our selling area.
Bearish Gartley Pattern


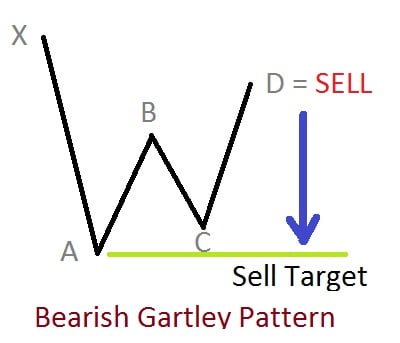
The bearish gartley pattern formation is similar to head and shoulders pattern, but as you can see the point C is below the point A, hence it is not head and shoulder pattern.

Formation of Bearish Gartley pattern and trading strategy:

  1. Point B can retrace 61.8% of XA movement.
  2. Point C can retrace anywhere from 38.2% to 88.6% of AB movement.
  3. Point D can be 138.2% or 161.8% extension of the CD move.
  4. Point D can retrace 76.8% of XA movement. Point D is our buying area.
Bullish Gartley Pattern

Stop loss in this is always very strict and hence we get very cool risk reward ratio, many times around 1:5 or more. The very important reason for trading this pattern is that it is based on uncertain places where traders are most afraid to take positions, hence giving better meaning for risk.

If you have any questions you can comment; in the meanwhile you can also like our page on Facebook.

Share
Tweet
Pin
0 Shares

You Should Read This:

  1. Head and shoulder pattern was formed in nifty future, How to identify reversal Head and shoulder pattern is also a popular trend reversal pattern formed on charts, once this pattern is formed there is high probability that initial trend will reverse soon. This type of pattern gets formed...
  2. Nifty future has formed double top pattern last week, Expect reversal On daily charts we have seen that nifty future has formed a double top pattern (A kind of short term reversal pattern), we are of view that nifty future is more likely to see a...
  3. Technical Analysis: How to trade Double bottom pattern Double bottom pattern is just opposite of double top pattern that we have discussed previously. This pattern is very easy to trade and learn how the market forces will be changing the direction of stock...
  4. How to Trade Nifty Options in Bearish Markets, Learn Strategies Trading Nifty options in bearish market, in bearish people traders say they lose money but fact is bearish markets offer best money making opportunity as panic is higher in these markets so markets react fast....
  5. Technical Analysis: How Double top pattern is traded A double top pattern is one of most simple and reliable pattern in technical analysis. There is a high probability that a trader will predict correct move most of the time. This pattern is very...

Category: Technical Analysis Tags: Bearish Gartley/ Bullish Gartley/ Gartley Pattern/ Trade Patterns/ Trading Strategy

About Bhaveek Patel

Bhaveek Patel is one of the most successful traders, technical analyst, and investor, his areas of interest include stock market, forex, and gold trading. Apart from this, he is often seen in the golf course. He is having more than 10 years of experience in trading, had placed his first order on 19 June 2006 with IndiaInfoline.

Comments

  1. Rajandran R says

    Do you think pattern trading will have less amount of risk when compared to strategic trading using mathematical models?

    Reply
    • Bhaveek Patel says

      Patterns are formed due to human psychological behavior, so reading those mindset of traders one can surely improve chances of success. However, with mathematical models I am not convinced most of the time. 🙂

      Reply
  2. kunal says

    Pattern trading is quite a riskier thing, one must have a solid trading strategy apart from just trading a pattern. Strategic approach for market can improve the success probability.
    I only trade double to and double bottom pattern as its just like support and resistance.

    Reply
  3. Junaid Sheikh says

    I agree with bhaveek bhai, patterns will always show you risk involved and the most chances of move in a particular direction.

    Reply
  4. harsh joshi says

    I only trade patterns and I have been successful in this trading method. all you need to manage is your risk.

    Reply

Leave a Reply Cancel reply

Your email address will not be published. Required fields are marked *

Previous Post: Technical Analysis: Ascending triangle pattern formed in Idea Cellular
Next Post: Technical Analysis: How Double top pattern is traded

Advance Options Trading Course

options trading course

Lowest Brokerage Trading A/c

Lowest brokerage trading account opening in India

Learn Technical Analysis

technical analysis course

Recent Articles

  • ASX Penny Stocks List for 2025
  • 7 Ways to Boost Your Revenue
  • NYSE Penny Stocks List for 2025
  • Short On Cash? Here’s How You Can Manage Your Priority Spends
  • FREE Webinar on Option Chain Analysis
  • LSE Penny stocks list for trading in 2025 Should you buy?
  • BSE Penny Stocks List 2025

Popular Categories

Amibroker Finance Forex Gold Intraday Stocks IPO Midcap Stocks Multibagger NEWS Nifty Nifty Option NSE Results Short Term Stocks Technical Analysis

About Us | Contact Us | Privacy Policy | Disclaimer


Copyright © 2009 - 2025 OurNifty.com Trading ideas published here cannot be reproduced without permission from the author.
OurNifty is Powered by Wordpress and hosted on Digital Ocean