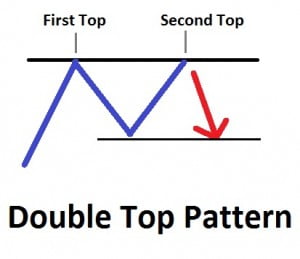
A double top pattern is one of most simple and reliable pattern in technical analysis. There is a high probability that a trader will predict correct move most of the time. This pattern is very easy to recognize and taking positions is quite simple. You can apply this to any time frame chart may it be weekly, daily or any intraday time frame chart. Have a look at the below image.

How to trade double top pattern:
- Watch the price action when it approaches the top for the second time.
- The second time is the best opportunity to initiate a short position in the stock.
- This short selling is applicable only for the second time.
- When the stock tries to test the same top for the third time then it is not that good to short as chances are price action may break that level. So a trader trying to trade the third top must place a strict stop loss and wait for the market to react. But stop loss is must here.
- This pattern gives you an excellent risk reward ratio, most of the time you are going to get 1:2 ratio. In most of the cases it also goes as high as 1:5, so 1 part is your risk and 5 parts are reward.
If you are looking to learn technical analysis call us on +91-9970777789 we offer the best courses in the industry.
Double bottom pattern is just like a support level. I can simply call it support level instead of double bottom. This pattern is very simple on chart, but how to set targets and stop loss is annoying.
This pattern in trading is highly watched for, i have created a script to find stocks forming this pattern. its still in beta testing period, will share it with you bhaveek.