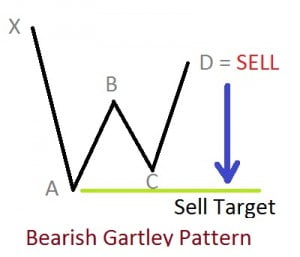
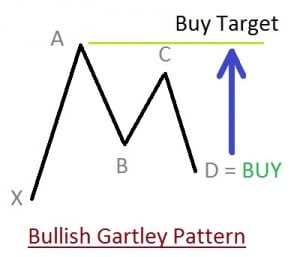
Another interesting tradable pattern is the Gartley Pattern. The Gartley pattern one of those most traded pattern, which takes advantage of higher risk reward ratio. This pattern shows major reversal points in market, also it works with slowing momentum if not reversal. So most of the time you will apply this pattern in medium term chart like weekly chart. Fibonacci retracements play important role in this pattern as reversal points are on retracement levels.
There are two types of Gartley pattern:
-
Bullish Gartley Pattern.
-
Bearish Gartley Pattern.
The bullish pattern is as seen below, its formation is quite similar to inverse head and shoulders pattern, but as you can see below point C is not on the same level as point A.
Formation and trading strategy of Bullish Gartley pattern:
- Point B must retrace 61.8% of AX movement.
- Point C must retrace anywhere from 38.2% to 88.6% of BA movement.
- Point D must be 138.2% or 161.8% extension of the BC movement.
- Point D must retrace 76.8% of AX movement. This is our selling area.

The bearish gartley pattern formation is similar to head and shoulders pattern, but as you can see the point C is below the point A, hence it is not head and shoulder pattern.
Formation of Bearish Gartley pattern and trading strategy:
- Point B can retrace 61.8% of XA movement.
- Point C can retrace anywhere from 38.2% to 88.6% of AB movement.
- Point D can be 138.2% or 161.8% extension of the CD move.
- Point D can retrace 76.8% of XA movement. Point D is our buying area.

Stop loss in this is always very strict and hence we get very cool risk reward ratio, many times around 1:5 or more. The very important reason for trading this pattern is that it is based on uncertain places where traders are most afraid to take positions, hence giving better meaning for risk.
If you have any questions you can comment; in the meanwhile you can also like our page on Facebook.
Do you think pattern trading will have less amount of risk when compared to strategic trading using mathematical models?
Patterns are formed due to human psychological behavior, so reading those mindset of traders one can surely improve chances of success. However, with mathematical models I am not convinced most of the time. 🙂
Pattern trading is quite a riskier thing, one must have a solid trading strategy apart from just trading a pattern. Strategic approach for market can improve the success probability.
I only trade double to and double bottom pattern as its just like support and resistance.
I agree with bhaveek bhai, patterns will always show you risk involved and the most chances of move in a particular direction.
I only trade patterns and I have been successful in this trading method. all you need to manage is your risk.