• Trading Account
  • Downloads
  • Nifty Options OI
    • Nifty Max Pain Chart
    • Nifty Option Change in OI Chart
    • Nifty Put Call Ratio
    • Nifty Option Total Change in OI
    • Nifty Trend Finder
  • BankNifty Option OI
  • About Us
  • Learn Technical Analysis
    • Advance Option Trading Course

OurNifty.com

A Indian Stock Market Blog

  • Forex
  • Gold
  • Intraday Stocks
  • Midcap Stocks
  • Multibagger
  • Nifty
  • Nifty Option
  • NSE
  • Amibroker

Technical Analysis: How to trade Double bottom pattern

By Bhaveek Patel 3 Comments

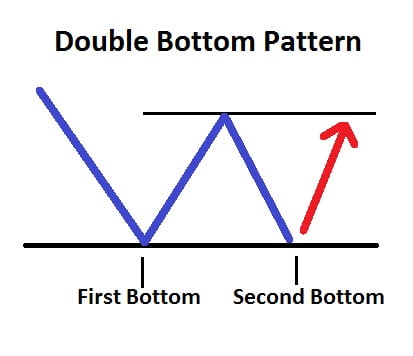
Double bottom pattern is just opposite of double top pattern that we have discussed previously. This pattern is very easy to trade and learn how the market forces will be changing the direction of stock at some level. In technical analysis, this pattern offers higher chances of success if trader picks the trade with this pattern. A trader can freely apply and trade this pattern on any time frame chart as he comfortable with, even on intraday time frame chart. See how this pattern looks in below image:

Double bottom pattern

How to trade Double bottom pattern:

  1. Check for the price to arrive near the second bottom zone.
  2. A trader should go long on the stock when it bounces at the second bottom. So our buying opportunity will be only at the second bottom level.
  3. Next time when the same level is reached, then trader must watch price action very closely. Next time the same level will be no trade zone. Because price action may break or hold the level. If a trader wanted to trade the third bottom, then strict stop loss should be followed.
  4. The double bottom pattern usually gives excellent trading opportunity with a higher risk-reward ratio, most of the time you may see 1:2 risk reward ratio. In many cases, it is also seen as high as 1:4, so 1 part is your risk and 4 parts are the reward if the trade goes in your favor.

If you want to learn technical analysis, call us on +91-9970777789.

Share
Tweet
Pin
0 Shares

You Should Read This:

  1. Technical Analysis: How Double top pattern is traded A double top pattern is one of most simple and reliable pattern in technical analysis. There is a high probability that a trader will predict correct move most of the time. This pattern is very...
  2. Technical Analysis: Buy Titan with target 313, Stock at support Daily chart of titan is showing a fresh trading opportunity for short term. As the trend in titan is up, so we are only looking to buy this stock on every declines. Stock has a...
  3. TCS trade setup for short term, Technical analysis suggests Strong buy Yesterday while I was resolving a query for one of my client I have landed into the TCS chart; I found that stock is ready for its next up move. So taking the positions in...
  4. Best Intraday Trading Strategy for Nifty Future, Using Technical Analysis Levels Nifty future is one of the most traded contracts on the National stock exchange (NSE), many traders follows day trading method in their trading strategy. Markets are mostly unpredictable as per their nature, but using...
  5. Trade using Gartley Pattern, Learn and trade patterns Another interesting tradable pattern is the Gartley Pattern. The Gartley pattern one of those most traded pattern, which takes advantage of higher risk reward ratio. This pattern shows major reversal points in market, also it...

Category: Technical Analysis Tags: Double Bottom Pattern/ Nifty Futures/ Technical Analysis

About Bhaveek Patel

Bhaveek Patel is one of the most successful traders, technical analyst, and investor, his areas of interest include stock market, forex, and gold trading. Apart from this, he is often seen in the golf course. He is having more than 10 years of experience in trading, had placed his first order on 19 June 2006 with IndiaInfoline.

Comments

  1. Abrar says

    The article are very informative, will very useful and easy to understand if you have explain the same with practical example of any stock in bse

    Reply

Leave a Reply Cancel reply

Your email address will not be published. Required fields are marked *

Previous Post: Medium term analysis for Bata India stock [Video]
Next Post: Short term Stock: Grasim is trading at support, Buy on dips

Advance Options Trading Course

options trading course

Lowest Brokerage Trading A/c

Lowest brokerage trading account opening in India

Learn Technical Analysis

technical analysis course

Recent Articles

  • ASX Penny Stocks List for 2025
  • 7 Ways to Boost Your Revenue
  • NYSE Penny Stocks List for 2025
  • Short On Cash? Here’s How You Can Manage Your Priority Spends
  • FREE Webinar on Option Chain Analysis
  • LSE Penny stocks list for trading in 2025 Should you buy?
  • BSE Penny Stocks List 2025

Popular Categories

Amibroker Finance Forex Gold Intraday Stocks IPO Midcap Stocks Multibagger NEWS Nifty Nifty Option NSE Results Short Term Stocks Technical Analysis

About Us | Contact Us | Privacy Policy | Disclaimer


Copyright © 2009 - 2025 OurNifty.com Trading ideas published here cannot be reproduced without permission from the author.
OurNifty is Powered by Wordpress and hosted on Digital Ocean